Predixion Insight, now 1.2
Predixion Insight 1.2 shipped today, with quite a few new features: PMML support, data profiling, data normalization, Visual Macros for all the tools, VBA API integration and many others.
The web site has a new look, our Support forums are now up and running — feel free to post your questions, for Predixion Insight or in general, for Data Mining in Excel.
Predixion Insight has now a splash screen with links to Video Tutorials, our online documentation and a rich sample dataset.
One feature that I love in this release is the Data Profiling feature. With a couple of clicks, this feature will compute common statistics for all columns in your PowerPivot or Excel dataset, and render a report allowing you to explore these statistics.
to try it out, go to Insight Analytics \ Explore Data and select Profile Data.
Like all other Predixion Insight tasks, this allows you to select an Excel range or table or a Power Pivot table as your data source for profiling.
The second pane of the wizard allows one to select the type of statistics to be collected: Basic or Advanced. Advanced is a bit slower (think milliseconds to seconds), but so much more useful.
The Data Profiling result is rendered in a new Excel sheet, with a few sections:
Data Summary
the first section, Data Summary, tells you what kind of columns were detected in your data and it looks like this:
CustomerID is identified as a likely key (a unique row identifier), so statistics will not be collected for this column
Continuous statistics
This section contains information about numeric columns. Here are the profile columns generated under Advanced analysis:
- # - the ordinal of the column in the source table. Useful if, after sorting by any other measure, one wants to restore the table to the original layout
- Column Name
- “Looks Like” – the result of the Predixion Insight heuristic analysis of the column. A column may be regarded as Interval (a range of values), Multinomial (a few distinct value, hence categorical or discrete), Binomial (2 values) or Constant (a single value)
- Count of Blanks, Minimum, Maximum, Mean, Sample Variance, Standard Deviation, Range, Kurtosis, Skewness, Standard Error of Mean, Approximate Median, Mode, the 95% confidence interval (assuming normal distribution). If you feel rusty about any of these metrics, just click on the column name and your browser will give you a friendly refresher
Discrete Statistics
Ordinal, Column Name, “Looks Like” and Count of Blanks appear again, just like in Continuous Statistics. The number of distinct states is added for discrete columns.
Other columns:
- Top 80% states – number of distinct states covering 80% of the data
- The Top 3 most/least popular values, with their respective counts
The report can be filtered by column name. You may notice that certain columns appear both in the Continuous and the Discrete section of the report. Such columns may have a numeric type but a distribution which suggests they should be regarded as categorical. The Data Profile report should help you decide whether to use Classify or Estimate for such columns. (If in doubt, this may help: No model for Constant, Estimate for Interval, Classify for all others)
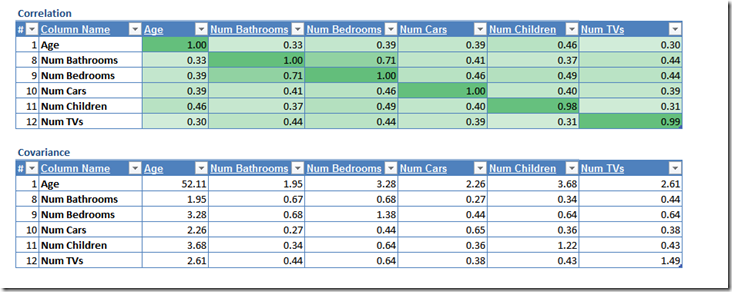
Correlation/Covariance
For numeric columns, here are the correlation and covariance matrices. While not very visible in this dataset, the correlation matrix uses a heat map from 1 (green, perfect positive correlation) to –1 (red, perfect negative correlation). White cells show no correlation (a value of 0). The Correlation matrix can be sorted by correlation for each individual column – sorting it by Column Index, #, will restore the shape of the matrix


