Book’s Blog

The “Data Mining with SQL Server 2008″ book  now has a blog. You can check it out at http://www.SqlDataMiningBook.com

Soon enough, there will be some content there:

- various data mining related postings from Jamie and me — all the product related postings on this blog will be replicated on the book’s blog . With a bit of discipline, all the postings will be tagged with the relevant chapter number

- errata (well, hopefully that won’t be the main topic of the blog :-) )

- any new downloads or other information that may be relevant for the readers

Data Mining with SQL Server 2008 + get your own free autographed copy!

DMBook


The new version of the SQL Data Mining book is finally available, at least at Amazon. If you are currently SQL DM user, you have an opportunity to get a free autographed copy  by filling out a short survey about the way you use SQL Server Data Mining. For more details about the survey, check Jamie’s blog post.

More details about the book here: Data Mining with SQL Server 2008

New Tool for Cloud Data Mining — Prediction calculator

Technorati Tags: ,,

A new SQL Server Data Mining tool is available now for you to use directly from the browser — the Prediction Calculator.

The feature (already present in the 2008 version of the Data Mining Add-ins) is a scorecard generator. The tool learns from your data and produces a simple calculator which can be used to compute a score (between 1 and 1000), score which describes the likelihood of a certain event. If you are not familiar with this kind of tools, think of the personality tests that appear in various magazines or about the FICO score.

When you launch the Prediction Calculator, you need to select a target column and a target value (or range). If you target column has categorical values, then you will need to specify exactly your target value. Example: if you want to predict whether some computer will crash in the next month, you will need to select, say, the “Yes” value of the “Will Crash in the Next Month” column. If your target is numeric, you can specify a range. For example, you can use the prediction calculator to figure out how likely it is that your insurance costs will grow between 20% and 50% in one year.

The result, depending on the columns in your data set, looks more or less like below. As you select different values for various columns, the score goes up or down. If it exceeds a certain threshold then you get a positive prediction, otherwise a negative prediction.

For example, try to play with the calculator below to figure out whether you are a likely Bike Buyer or not:

How it works: each of the attributes gets a score, depending on the state. For example, having 0 cars may score 100 points, while having 2 cars may score 0 points (people with many cars are less likely to purchase a bike). The points are added up and, if the total score (always between 0 and 1000) exceeds a certain threshold, then the prediction is positive, otherwise negative.

The Prediction Calculator tool allows you to determine the threshold that maximizes your “profit”. In the lower part of the prediction calculator result (not visible in the embedded snapshot above) you can specify the costs associated with a False Positive (Type I) or False Negative (Type II) error. You can also specify any profits deriving from a correct positive or negative prediction.

The tool computes the total profit generated by various score thresholds based on your inputs and produces a set of diagrams, one for profit and one for cumulative costs, like below:

You can see in the profit diagram that the profit is maximized for a score around 450 or 500. The costs are also minimized in that area.

The tool detects the scorecard threshold that optimizes the profit (and includes it in the page).

Once you produce and tune a prediction calculator, you can embed it in your HTML page, just copy and paste the HTML fragment — the Bike Buyer calculator above is such a fragment.

Data Mining for the Cloud (or how I spent my summer)

This week, at the KDD (Knowledge Discovery and Data Mining) conference, we (as in Microsoft SQL Server Data Mining team) presented the Table Analysis Tools for the Cloud, a preview for a technology that enables anybody to play with some of the Microsoft’s data mining tools, without any bulky downloads and with zero configuration effort.

Around May this year I practically entered some sort of sabbatical: 3 months to work on an incubation project of my choice (yes, the Microsoft SQL Server organization does this kind of things! if it sounds appealing,  check out our recruiting site or, even better, contact directly our SQL Server Data Mining recruiter, Melsa Clarke - melsac AT microsoft DOT com). With some help from Jamie, various management levels and some nice guys in the SQL Server Data Services team, I gathered the infrastructure for a Software as a Service incubation and set up a web incarnation of the Table Analysis Tools add-in for Excel.

Now it is up and running. The entry page is at sqlserverdatamining.com/cloud, so if I got you bored already and you don’t want to read the rest of this stuff, go ahead and browse that page.

image


What it is

TAT Cloud is a set of canned data mining tasks that you can use without having SQL Server installed on your machine.  It consists of encapsulations of some common data mining problems, such as detecting key influencers, forecasting, generating predictive scorecards or doing market basket analysis. The tasks can be executed directly from your browser: just go to the web page, upload your data (in CSV) format and run a tool from the toolbar. Even better, the tasks can be executed directly from Excel. For this, however, you will need to have Excel 2007 and install an add-in which can be downloaded from here.

All tasks work on a table (Excel table or a table in CSV format that you upload to the web interface). All tasks produce reports that can be used to learn more about the analyzed data.

Here is a complete list of features:

  • - Analyze Key Influencers: it detects the columns that impact your target column. It presents a report of those values in other columns that correlate strongly with values in your target column.
  • - Detect Categories (clustering, for data miners) — identifies groups of table rows that share similar characteristics. A categories report is generated, which details the characteristics of each category
  • - Fill From Example — to some extent, similar to Excel’s Autofill feature: it learns from a few examples and extends the learned patterns to the remaining rows in the table
  • - Forecasting — analyzes vertical series of numeric data, detects periodicity, trends and correlations between series and produces a forecast for those series
  • - Highlight Exceptions — finds the interesting (or unusual, or out-of-ordinary) rows in your table
  • - Scenario Analysis — What-If and Goal-Seek tools based on a probabilistic model built on top of your data.
  • - Prediction Calculator — a tool for generating prediction scorecards
  • - Market Basket Analysis — analyzes transaction tables to identify groups of items that appear together in transactions

All features work from Excel. However, not all the features are implemented in the web interface. They will show up eventually!

A really nice presentation of how to use the tools was written by Brent Ozar on SQLServerPedia. Thanks, Brent!


How it works

Your data (CSV file or Excel spreadsheet) is uploaded to the web service site. There, Analysis Services crunches it and produces the reports you get either in the browser or in a different spreadsheet. The data and the mining model used for analyzing it are  deleted immediately after processing. If something bad happens and your session does not conclude successfully (fancy wording for "if it crashes") then both data and models are removed automatically after 15-20 minutes.

You will notice in the Excel add-in (as well as in the web interface) a strange IP address, 131.107.181.99 — this is IP of the service. It will be changed to something cleaner very soon.

Excel uses HTTPS to connect to the service, in an effort to protect your data. However, you should not use this technology on sensitive data.


What it is not

This is not an official shipping Microsoft technology. It is actually less than even a beta. It may crash, it may produce incorrect results, it may be shot down at any time. BTW, I would appreciate if you posted note here or on the Microsoft data mining forums if this happens (particularly about crashes, I should probably know if it gets shut down)!


What next

Well, try the tools: sqlserverdatamining.com/cloud . I recommend downloading the Excel 2007 add-in, rather than using the web application, as it is more functional. Post any questions you might have on the Microsoft data mining forums. And check out this blog periodically for announcements (typically new additions to the web interface) or for more details on how this stuff works

Companion for MS Analysis Services


Today I discovered a very nice Analysis Services client tool. Produced by SQLMinds, the tool seems a great addition to Analysis Services. It provides many components, among them a performance tuning service, an OLAP cube browser for the web and a very nice web front end for data mining, the DM Companion tool which can be launched at http://x32.sqlminds.com/dmcompanion.

So, here are a few really nice things about the DM Companion tool (BTW, a fully working demo is running at the aforementioned URL).

The tool works to some extent like a Data Mining -specific SQL Server Management Studio for the web. Therefore, it allows you connect to the server of your choice (through the Analysis Services HTTP pump). The demo seems to allow anonymous connections (pretty safe  as all the interactions offered by the tool are read-only).  Next you get to chose your AS catalog and the mining model you want to use.

For each model you have the option to browse the content or execute predictions.

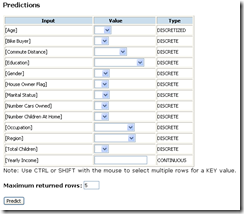
The prediction feature provides a nice interface for defining singleton predictions, as you can see below:

image

The interface supports specifying multiple nested table keys as input, so the tool can perform associative predictions as well. It reminds me of the XMLA Thin Miner sample running on SQLServerDatamining,com, however, it looks much better and is nicely integrated with the rest of the application. While prediction functions do not seem to be directly supported, the application is able to predict a cluster for clustering models.

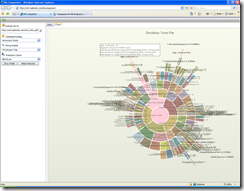
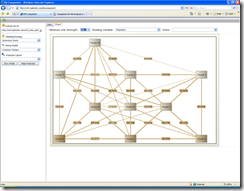
The model browsing features are really nice. Analysis Services includes a set of sample web viewers for Naive Bayes, Trees and Clustering. This application provides some seriously better looking viewers for these algorithms, and extends the suite at least for Neural Networks (a really nice viewer), Sequence Clustering and Association Rules.  The DM Companion viewers offer all the features in the sample viewers, with a nicer implementation which uses AJAX and has better graphics, plus a solid set of new features, the most spectacular being the interactive dependency net browser and the pie chart visualization for decision trees, which you can see below.

image image


Overall, DM Companion looks like a really nice tool for sharing your data mining implementation on the web

DMX Pitfalls : Natural Prediction Joins

Some very interesting, although time-consuming project kept me away from posting in the last month. Mea maxima culpa, I will try to catch up and put some new and interesting content here more often.

Recently, trying to make sense of some prediction results, I realized that the DMX NATURAL PREDICTION JOIN statement has some obvious and some not so obvious dangers, which deserve some clarification.

To summarize, the PREDICTION JOIN operator is used to apply patterns from a trained mining model against new data. The general syntax is

SELECT EducationLevel

FROM MyModel

PREDICTION JOIN

OPENQUERY(MyDataSource, ”SELECT Height, , HairColor, ShoeSize FROM CustomerInfo’) AS T

ON

T.Height = MyModel.Height AND

T.HairColor = MyModel.HairColor AND

T.ShoeSize= MyModel.ShoeSize

In the standard PREDICTION JOIN statement, the ON clauses specify how columns from the new data are to mapped to the input columns of the mining model.

The statement supports a simplified format:

SELECT EducationLevel

FROM MyModel

NATURAL PREDICTION JOIN

OPENQUERY(MyDataSource, ”SELECT Height, HairColor, ShoeSize FROM CustomerInfo’) AS T

In the simplified format, the columns from the new data are mapped to the input columns of the mining model by name. Much easier to type, resulting in a more readable statement!

Now, the natural mapping may end up in three different scenarios. In the first scenario, all the model’s input columns find a corresponding data column in the input. The mapping is performed correctly and everything works as expected. Nothing to blog about in this case!

The second case: some of the inputs are mapped correctly to model columns, some are not, although you would expect them to be mapped correctly. More than a simple user error, this situation is actually “facilitated” by the way the BI Dev Studio works. Assume you start with a table containing 4 columns: Height, HairColor, ShoeSize, EducationLevel and use BI Dev Studio to create a mining structure and a model. BI Dev Studio will generate more friendly names for the columns and your mining model ends up with the structure below:

MyModel

(

Height

[Hair Color],

[Shoe Size],

[Education Level]

)


[Read more →]

Video Tutorials for Business Intelligence with Excel 2007

MyVBProf.com hosts a set of great video tutorials for performing business intelligence tasks with Excel 2007. Bill Burrows starts with the installation of pre-requisites. He even shows how to make sure that Excel .Net Programmability Support is available! Wow!!

Bill then follows up with a set of tutorials on pivot tables and wraps up with videos on using the Table Analysis Tools from the SQL Server Data Mining add-ins for Excel. His approach is accessible, his style is captivating, his examples are meaningful and very well explained.

Therefore:

1. If you have SQL Server 2005 or 2008 CTP these tutorials give you a great start for BI using Excel and Analysis Service.

2. If you do not have SQL Server, get a free evaluation from http://www.microsoft.com/sql/downloads/trial-software.mspx, then go back to the previous point

3. You don’t have SQL Server, don’t want to try it out, don’t care about the data mining part — fine, just watch some of the tutorials to see what you miss!

Microsoft Neural Network — Step-by-step Predictions

A recent post on the MSDN Forums raises the issue of reconstructing the Microsoft Neural Network and reproducing the prediction behavior based on the model content. The forum did not allow a very detailed reply and, as I believe this is an interesting topic, I will give it another try in this post. As an example, I use a small neural network which is trained on two inputs, X (having the states A and B) and Y (C and D) in order to predict a Z discrete variable, having the states E and F.

This post is a bit large, so here is what you will find:

  • - a description of the topology of the Microsoft Neural Network, particularized for my example
  • - a step-by-step description of the prediction phases
  • - a set of DMX statements that exemplify how to extract network properties from a Microsoft Neural Network mining model content
  • - a spreadsheet containing the sample data I used as well as a sheet which contains the model content and uses cell formulae to reproduce the calculations that lead to predictions (the sheet can be used to execute predictions for this network)

The network topology

Once trained, a Microsoft Neural Network model  looks more or less like below:

image

During prediction, the input nodes are populated with values deriving from the input data. The values are linearly combined with the edges leading from input nodes to the middle (hidden) layer of nodes and the input vector is translated to a new vector, which has the same dimension as the hidden layer. The translated vector is then “activated” using the tanh function for each component. The resulting vector goes through a similar transformation, this time from the hidden layer to the output layer. Therefore, it is linearly converted to the output layer dimensionality (using the weight of the edges linking hidden nodes to output nodes). The result of this transformation is activated using the sigmoid function and the final result is the set of output probabilities. These probabilities are normalized before being returned as a result (in a call like PredictHistogram)

[Read more →]

How much training data is enough?

This an actual question I had to answer in one of the previous Tech Ready conferences: when does one know that feeding more data to the mining model will stop improving accuracy? Or: how much training data is enough? With the new accuracy procedures in SQL Server 2008, I think I have now a better answer.

Algorithms learn from data and, generally, feeding them with more data will improve the accuracy. This improvement, however, is asymptotical. If the training data is statistically representative for the problem space, then a classifier will stop learning after a certain limit: new data points will support existing patterns and will help reducing the risk of over-training,  but will not add more information to the model. The solution I suggest for SQL Server 2008 allows you to figure out if your mining model is likely too gain from adding new data or is likely to maintain the same accuracy.

The solution is based on the cross validation mechanism, so I’ll start with a small presentation of this mechanism. The cross-validation takes a data set, splits it into a number of (roughly equal size) partitions, called folds, then builds a set of mining models (as many as there are folds). Each mining model is built on top of the whole data set minus one of the folds and then the accuracy of the model is measured on the fold that was left out. Effectively, all data is used in training and all data is left out (by at least one mining model). Also, each model is validated against data that was not seen during training. The accuracy measures for each model are then evaluated across all the folds. A good mining solution would provide compact accuracy measurements (i.e. no big differences between the measurements on different folds). Spikes in the measurements may indicate problems with the data. Note that cross validation does not improve the accuracy of the model, it just provides an “honest” estimation of that, reducing the risk of over-training.

In SQL Server 2008, cross validation allows the user to specify how many cases should be used for the procedure. This is mainly for performance purposes — it allows a quick comparison between different mining models/algorithms on the same data set.

Now back to the original problem: would adding new data benefit the accuracy?

[Read more →]

DMX in 2008: Model Filtering (Part 2 of 2)

This second post on model filtering deals with nested table filters. The most common use of nested tables in SQL Server Data Mining is to model transaction tables. That is, model Customer entities together with the “bag” of products they purchased.

Nested table filters primarily serve two purposes:

  • - Use (in the model) only those nested table rows with a certain property (e.g. consider only products that are not “Coca Cola”, because most people do buy “Coca Cola”, so it is not that interesting)
  • - Use (in the model) only those cases where the associated nested tables have certain properties (e.g. - build a prediction model on customers that have purchased Coca Cola)

Notice the difference between the filters: while the first filter removes products from shopping baskets before modeling, the second removes customers from the model (those that have not purchased Coca Cola).

[Read more →]